Ermaksan EVO-IV: How to Verify Press-Brake Energy Savings Before Building the ROI Case
What would Ermaksan’s reported press-brake energy savings mean for your shop’s actual production? The manufacturer’s EVO-IV benchmark is a starting point for evaluation, not a substitute for measuring your own work. A credible capital case compares energy use with comparable output and operating conditions, then applies the facility’s electricity costs.
Understand the claim and the machine
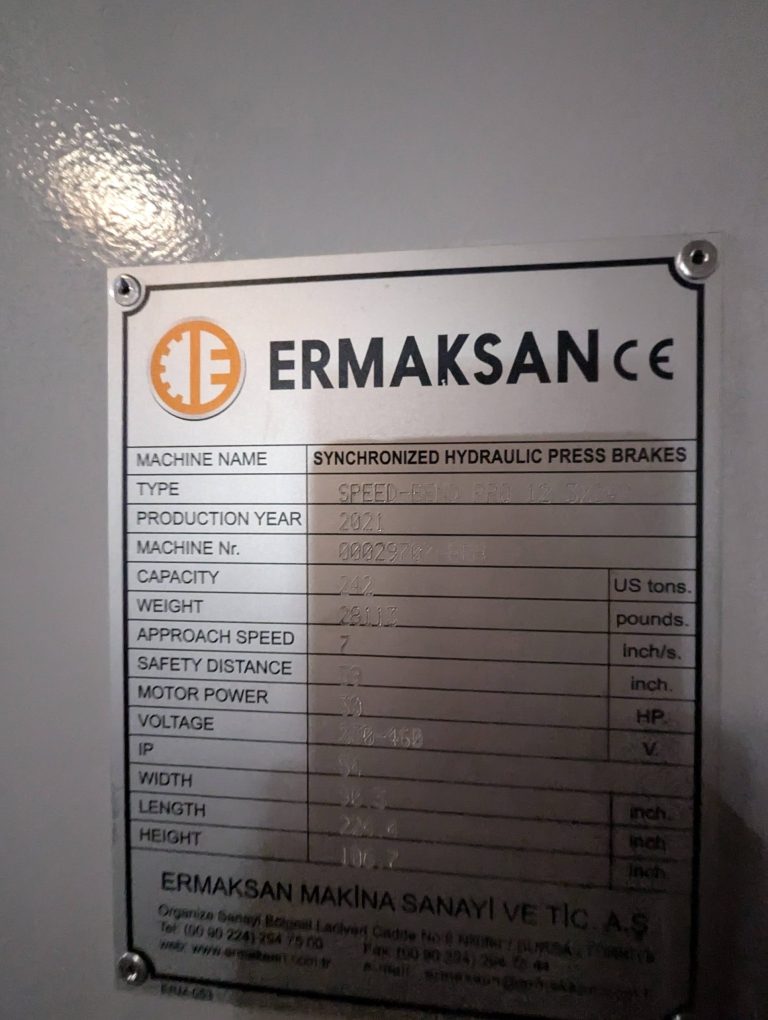
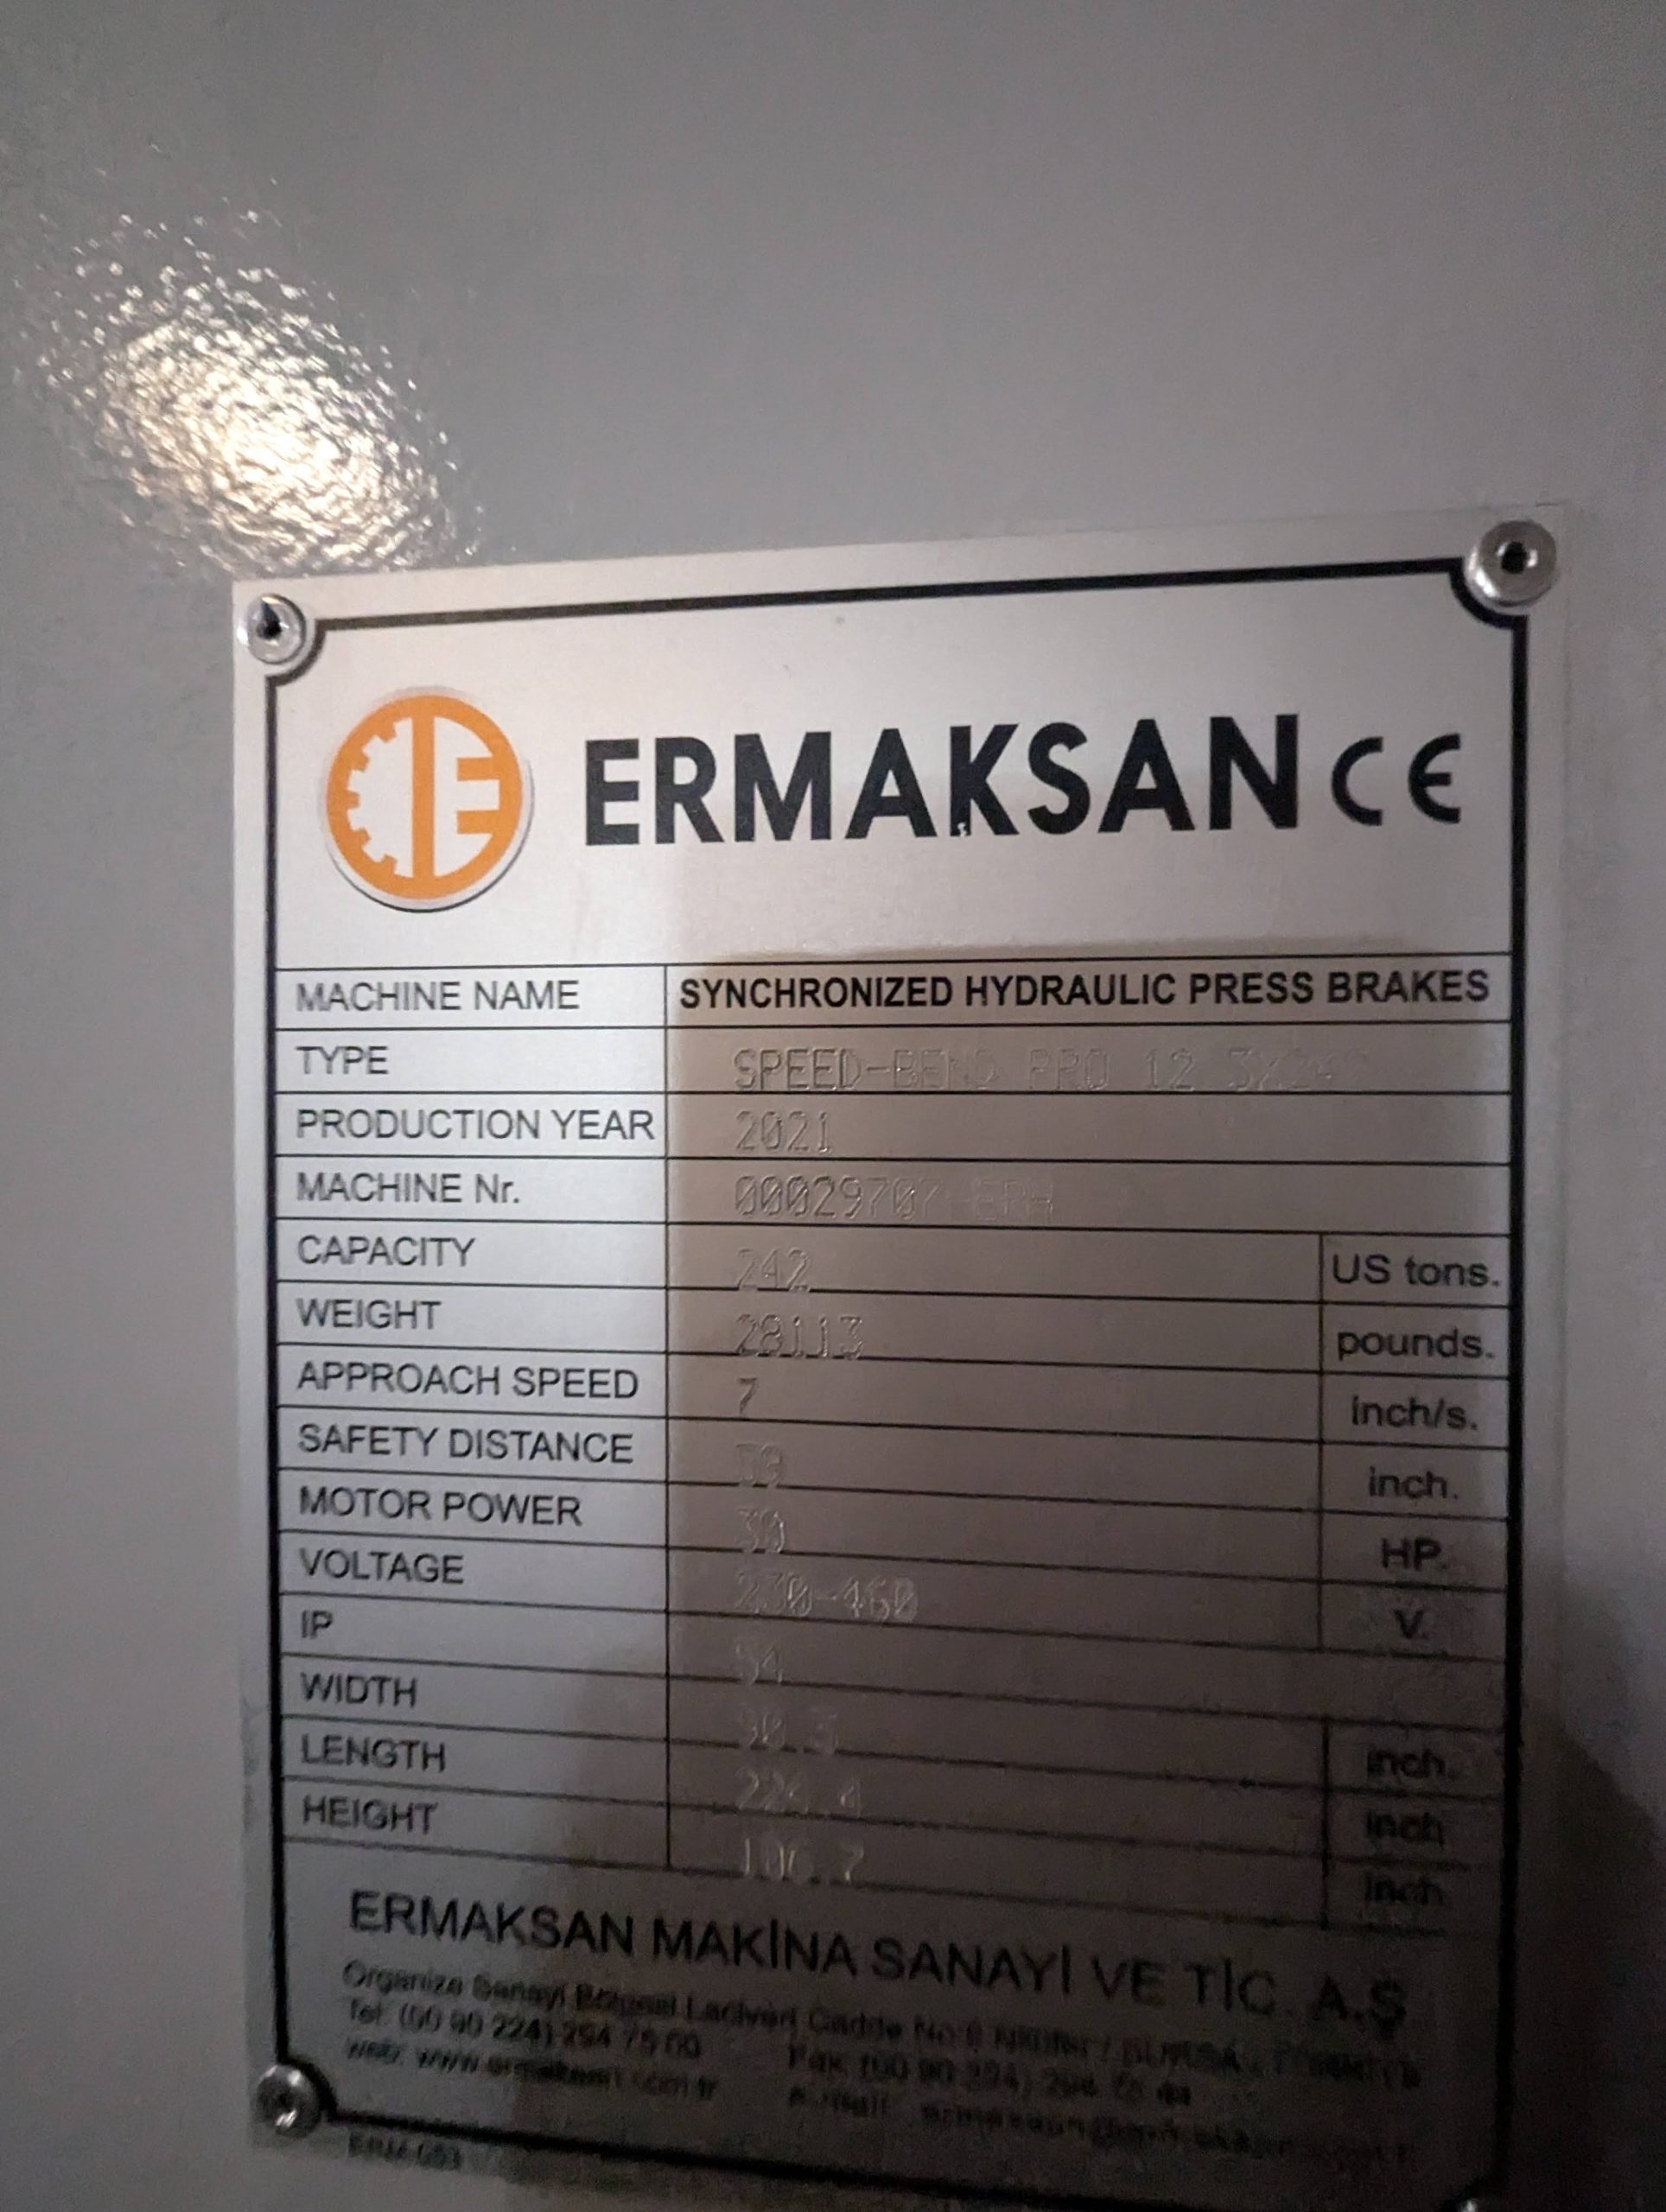
Ermaksan describes the EVO-IV as a servo-hybrid press brake combining servo motor control with an SPVM/SPLM-based closed-loop hydraulic system. The manufacturer says servo control manages machine movements, including the main drive and backgauge axes, while hydraulic power is supplied as needed.
Ermaksan reports up to approximately 65% lower energy demand than a conventional hydraulic reference under specified benchmark conditions: a 220-ton, 3100 mm press brake completing 870 cycles during an eight-hour production run. The company also states that results vary with application and operating conditions. The claim is manufacturer-reported; it should not be treated as an independently verified result or a guaranteed reduction at a particular plant.
Establish a baseline before comparing
Before changing equipment, measure energy use on the incumbent brake during representative production. Then compare it with EVO-IV operation on equivalent work. The U.S. Department of Energy’s manufacturing eGuide recommends collecting baseline data before a change and comparing it with post-change measurements under representative, as-consistent-as-possible conditions.
Use an appropriately rated meter or machine-level measurement method to capture electricity consumption over a defined period, and record production data for that same period. For each run, document:
- Part family, material, thickness, tooling, and bend mix
- Good parts or completed runs, cycle count, and production hours
- Setup and idle time, shift schedule, and relevant operator practices
If identical parts cannot be run on both machines, compare representative part families separately. A different material mix, batch size, schedule, or idle period can affect measured energy use. Document those differences; do not present an unlike comparison as a like-for-like result.
Compare energy per comparable output
Total kilowatt-hours can be misleading when output changes. DOE guidance describes energy intensity as energy consumption divided by productive output, with both measurements covering the same time frame. For a comparable run, calculate:
- Energy per output: measured kWh divided by good parts produced, or by a clearly defined comparable run
- Energy difference: incumbent kWh per comparable output minus EVO-IV kWh per comparable output
- Indicative energy-cost difference: the measured kWh difference multiplied by an applicable energy rate
Use the facility’s actual tariff and billing structure rather than a national average. A simple kWh-times-rate calculation is an estimate of energy-charge impact; time-of-use rates, demand charges, and other bill components may affect the actual change in total electricity costs. Have finance or facilities staff review the calculation. EIA manufacturing energy-price data can provide broad context, but it does not validate EVO-IV performance or replace the shop’s tariff.
For an annual estimate, apply the measured difference to a realistic production profile and make assumptions visible, including run hours, product mix, utilization, and electricity rates. Use a range when those inputs are uncertain. Do not infer payback without measured consumption, production data, actual electricity costs, and total project costs.
Evaluate the rest of the investment separately
Energy is only one part of the capital decision. Assess first-piece quality and repeatability, uptime and service support, maintenance requirements, operator training, tooling transfer, control and programming workflow, and material handling fit. Ermaksan describes the EVO-IV’s closed-loop hydraulic layout as compact and designed to simplify maintenance access; validate the expected service requirements and support arrangements for the proposed configuration.
Track scrap or rework, setup time, output, and downtime as separate operating measures rather than folding them into the energy result. Confirm the machine configuration suits the shop’s real part and material range, and define acceptance criteria for any production trial.
The practical test is straightforward: establish a credible baseline, compare equivalent work, apply the facility’s tariff, and evaluate quality, uptime, maintenance, and workflow on their own merits. The manufacturer’s benchmark can justify a closer look, but the shop’s measured data and project costs must support the investment case.